GM Properties continues to keep our clients informed on the latest market trends shaping Southern California’s commercial real estate landscape. Recently, our partner, AIR CRE, held its Q1 2026 Research Insights Town Hall, presented by Monique Ebel, Director of Research. The following summarizes key data and insights from the session and accompanying research report.
Market Overview
Southern California’s industrial market remains in an adjustment phase as elevated availability, slower tenant decision-making, and moderated asking rates continue to shape leasing and investment conditions.
Direct lease availability increased again in Q1 2026, reaching one of the highest levels in the current data set. At the same time, leasing activity improved year over year, showing that transactions are still moving forward even as tenants remain selective and space takes longer to absorb.
Asking rates continue to soften from peak levels reached in 2023, although the pace of decline appears to be moderating. Sublease availability remains elevated compared with pre-pandemic levels but has declined from recent highs, suggesting that some of the excess space created during the logistics expansion period is gradually being worked through.
The construction pipeline continues to pull back, which may help the market move toward better supply-demand balance over time. However, the near-term environment remains competitive for owners, especially in markets and building categories with higher availability.
Direct Lease Availability
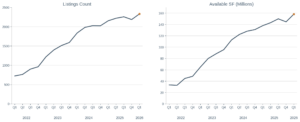
- Existing Listings: 2,333 listings over 10K SF across the region.
- Square Footage: Approximately 158.3M SF of direct lease availability across Southern California.
- Newly Added Listings: 611 new listings totaling approximately 76.4M SF added during the quarter.
Trend
Industrial availability continued to rise in Q1 2026, with total available square footage up approximately 15% year over year. The quarter also saw a significant increase in newly added available square footage, driven in part by larger spaces coming to market. While this increase does not necessarily indicate a sustained acceleration in new availability, it reinforces the continued competition owners face in the leasing market.
Owner Takeaway
Owners should expect continued competition for tenants and should evaluate pricing, concession strategy, tenant improvement expectations, and lease flexibility against comparable active listings.
SOUTHERN CALIFORNIA INDUSTRIAL DIRECT LEASE AVAILABILITY
AVERAGE ASKING RATES
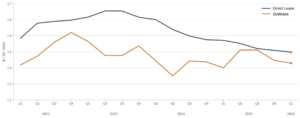
- Direct Lease: $1.397 NNN average asking rate across the region.
- Sublease: $1.328 NNN average asking rate across the region.
- Year-over-Year Change: Direct lease asking rates declined approximately 5% year over year, while sublease rates increased slightly year over year.
Trend
Direct lease asking rates continue to moderate from the market peak reached in 2023. The decline has been gradual but consistent, reflecting higher availability and more competition among landlords. Sublease pricing has remained comparatively stable, although it continues to sit below prior peak levels.
Rate reduction activity has also eased significantly from earlier highs. This may indicate that much of the initial repricing has already occurred, but owners should continue to monitor competing space closely as tenant demand remains selective.
Owner Takeaway
Owners should avoid relying on outdated peak-rate assumptions. Competitive positioning should be based on current market comps, building quality, and the specific tenant demand profile for each asset.
SOUTHERN CALIFORNIA INDUSTRIAL AVERAGE ASKING RATES: DIRECT LEASE VS. SUBLEASE
DIRECT LEASE TRANSACTIONS
- Volume: 402 direct lease transactions completed during the quarter.
- Total Square Footage: Approximately 26.3M SF leased across Southern California.
Regional Distribution
- Inland Empire: 0M SF
- Los Angeles County: 8M SF
- Orange County: 1M SF
- Ventura County: 396K SF
Trend
Leasing activity improved in Q1 2026, with both transaction count and total square footage increasing year over year. The Inland Empire continued to drive the largest share of activity, particularly in buildings over 100,000 SF. Los Angeles County remained active across multiple size ranges, while Orange County and Ventura County represented smaller shares of total regional volume.
The increase in transactions is an important counterpoint to rising availability. Demand has not disappeared, but tenants are taking longer to evaluate options and are often choosing from a broader field of competing spaces.
Owner Takeaway
Well-located, functional buildings with strong logistics attributes remain competitive, but owners should be prepared for longer decision timelines and more detailed tenant comparisons.
SUBLEASE MARKET
- Availability: 354 sublease listings totaling approximately 28.0M SF.
- New Additions: 100 new sublease listings totaling approximately 5.0M SF.
- Rates: Average sublease asking rates were approximately $1.328 NNN.
- Transactions: 41 sublease transactions totaling approximately 2.4M SF during the quarter.
Trend
Sublease availability remains well above pre-pandemic levels but has declined year over year. Newly added sublease space has also slowed, suggesting that the surge of excess space from prior expansion decisions may be easing.
Sublease transaction activity increased from the prior quarter, although it remains lower year over year. The Inland Empire accounted for the largest share of sublease square footage, while Los Angeles County also remained active across multiple size ranges.
Owner Takeaway
Sublease space remains a meaningful source of competition. Owners should emphasize building condition, operating efficiencies, location advantages, and lease certainty when competing against discounted or shorter-term sublease options.
Sales Market
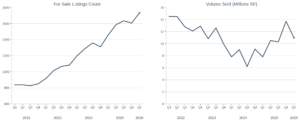
- For-Sale Supply: 1,733 listings totaling approximately 67.2M SF.
- Sales Activity: 308 transactions completed during the quarter.
- Volume Sold: Approximately 10.9M SF of industrial property sold.
- Average Pricing: Approximately $307 per square foot.
Regional Leaders
- Inland Empire: 8M SF sold
- Los Angeles County: 2M SF sold
- Orange County: 6M SF sold
- Ventura County: 284K SF sold
Trend
For-sale inventory continued to rise in Q1 2026, with available square footage up approximately 24% year over year. Sales transaction count declined year over year, but total square footage sold increased, indicating that larger transactions helped support overall volume.
Average sold price per square foot declined year over year but remains slightly above where it was earlier in the cycle. This reflects a market where buyers remain active but are more disciplined on pricing, financing assumptions, and asset selection.
Owner Takeaway
Industrial assets continue to attract buyer interest, but pricing expectations should reflect current capital market conditions, higher available inventory, and more selective underwriting.
SOUTHERN CALIFORNIA INDUSTRIAL SALES: LISTINGS VS. VOLUME SOLD
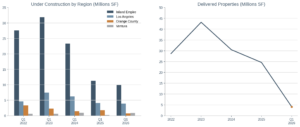
CONSTRUCTION PIPELINE
- Under Construction: Approximately 15.3M SF currently under construction across Southern California.
Regional Distribution
- Inland Empire: 9M SF
- Los Angeles County: 9M SF
- Orange County: 755K SF
- Ventura County: 812K SF
- Deliveries: Approximately 4.1M SF completed during Q1 2026, with approximately 5.3M SF projected for Q2 2026.
Trend
Construction activity continues to decline from prior-cycle highs, with total square footage under construction down approximately 13% year over year. The Inland Empire still accounts for the majority of the region’s construction pipeline, while Los Angeles County, Orange County, and Ventura County represent smaller shares.
The pullback in construction is an important long-term signal for owners. As fewer new projects enter the market, the region may gradually work through elevated availability. However, recently delivered space and projects already underway will continue to affect competition in the near term.
Owner Takeaway
Reduced construction starts may support future stabilization, but owners should continue to plan around current competitive conditions rather than assuming an immediate supply-demand reset.
SOUTHERN CALIFORNIA INDUSTRIAL CONSTRUCTION
STRATEGIC RECOMMENDATIONS FOR OWNERS
- Price Realistically: Align asking rates with current market activity, not prior peak conditions.
- Compete Beyond Rate: Building condition, clear communication, tenant improvements, and flexibility may help differentiate assets in a more competitive leasing environment.
- Monitor Sublease Competition: Sublease availability remains elevated and may influence tenant expectations on pricing and lease terms.
- Evaluate Timing Carefully: Longer decision-making periods and increased available inventory should be factored into lease-up assumptions and capital planning.
- Prepare for Gradual Stabilization: The construction pipeline is shrinking, but elevated inventory will take time to absorb. Owners who maintain competitive, well-positioned assets will be better prepared as conditions improve.
Connect with GM Properties
Understanding market conditions is essential when evaluating leasing strategy, asset performance, and long-term investment decisions. GM Properties provides property management, asset management, and brokerage services for commercial real estate owners throughout Southern California.
To learn how current market trends may impact your property or portfolio, contact GM Properties.