
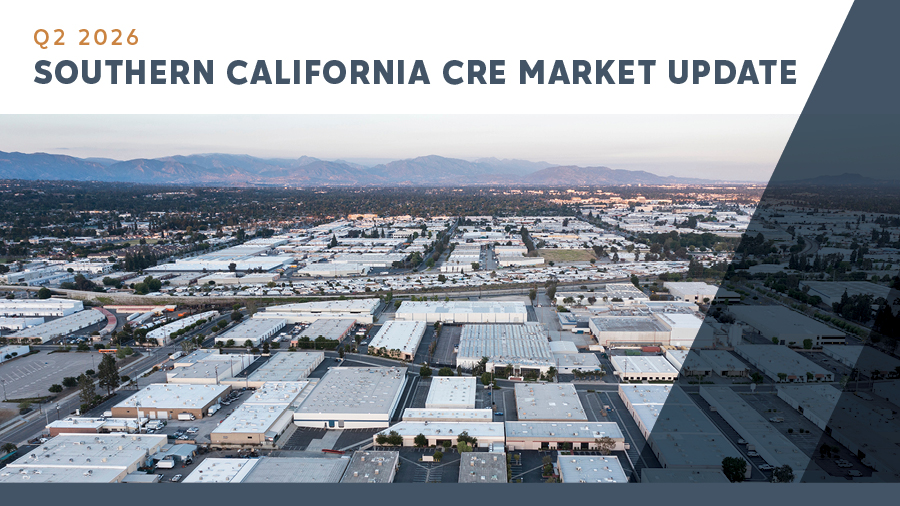
Southern California’s industrial market continued to evolve during the second quarter of 2026, with expanding availability balanced by stronger leasing and sales activity. Recently, our partner, AIR CRE, held its Q2 2026 Research Insights Town Hall presented by Monique Ebel, Director of Research. Drawing on AIR CRE’s presentation and supporting regional research, this update highlights the trends most relevant to commercial property owners and investors across Southern California.
Market Overview
Southern California’s industrial market continued to adjust in Q2 2026, but the latest data shows a more nuanced picture than rising availability alone might suggest.
Direct lease square footage reached a new high even as the number of listings edged down from the first quarter. At the same time, direct lease transaction count and square footage both reached new highs in the current data set, confirming that tenants are still completing deals despite having more choices and taking longer to make decisions.
Asking rates continued to ease gradually, while sublease availability declined further from its recent peak. The sales market also strengthened by total square footage sold, although a large portfolio transaction contributed to the quarter’s record volume.
The active construction pipeline remains well below prior-cycle levels, which should help limit future additions to supply. Near-term conditions, however, remain competitive: time on market is rising, sale inventory is expanding, and proposed development continues to build.
Direct Lease Availability
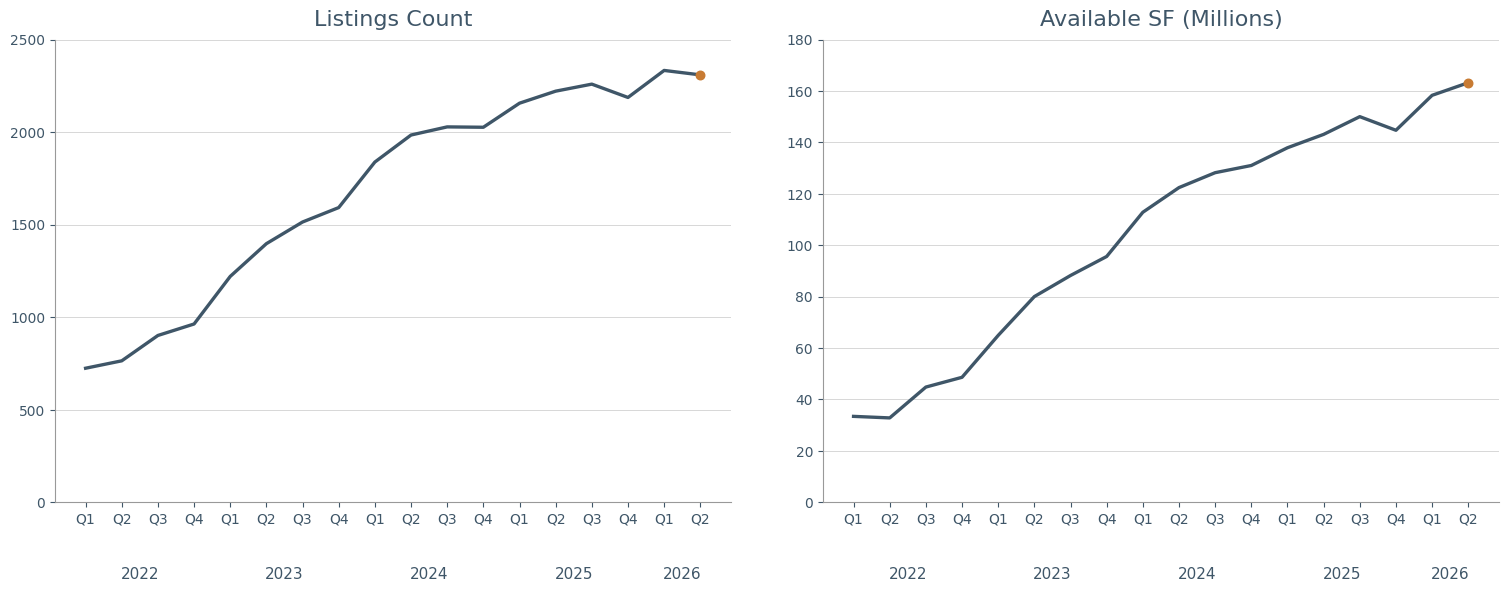
- Existing Listings: 2,309 listings over 10K SF across the region.
- Square Footage: Approximately 163.2M SF of direct lease availability across Southern California.
- Newly Added Listings: 543 new listings totaling approximately 45.9M SF added during the quarter.
Trend
Total listing count declined slightly from 2,333 in Q1, but available square footage increased to a new high. Year over year, listings rose approximately 4% and available square footage increased approximately 14%. Newly added listings and square footage both pulled back sharply from the first quarter, reinforcing that Q1’s surge was driven by several unusually large additions rather than a sustained acceleration in new supply.
Owner Takeaway
Owners should plan for continued competition, particularly from larger blocks of available space. Pricing, concessions, tenant improvements, and lease flexibility should be evaluated against current active listings—not simply prior-quarter averages.
SOUTHERN CALIFORNIA INDUSTRIAL DIRECT LEASE AVAILABILITY
AVERAGE ASKING RATES
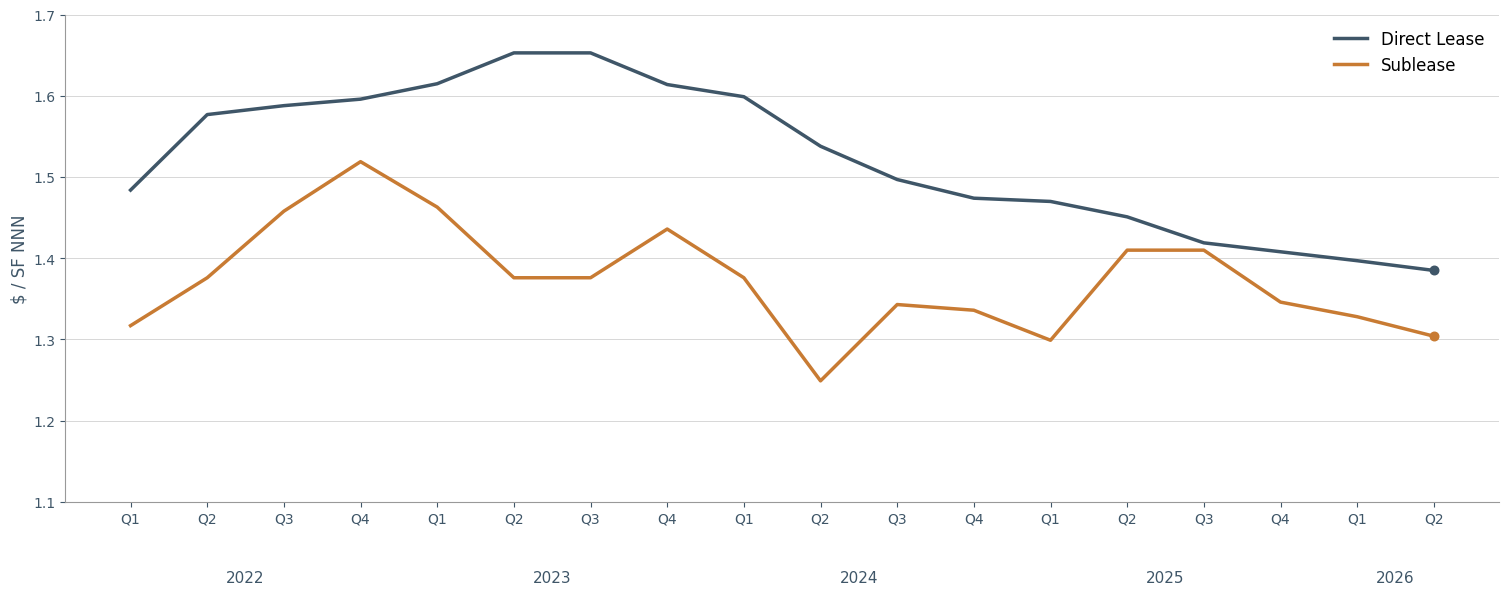
- Direct Lease: $1.385 NNN average asking rate across the region.
- Sublease: $1.304 NNN average asking rate across the region.
- Year-over-Year Change: Direct lease asking rates declined approximately 5% year over year, while sublease asking rates declined approximately 8%.
Trend
Direct lease asking rates declined modestly from $1.397 in Q1 and are now approximately 16% below the mid-2023 peak. The gradual quarter-to-quarter movement suggests continued repricing without a sharp market correction.
Sublease rates fell from $1.328 to $1.304 and remain more variable than direct lease pricing. Rate reductions increased slightly during the quarter but remained historically low, with nearly 63% concentrated in Los Angeles County.
Owner Takeaway
Owners should use current, building-specific comparables and monitor competing direct and sublease space closely. A small market-wide rate change can mask meaningful differences by submarket, building size, condition, and functionality.
SOUTHERN CALIFORNIA INDUSTRIAL AVERAGE ASKING RATES: DIRECT LEASE VS. SUBLEASE
DIRECT LEASE TRANSACTIONS
- Volume: 444 direct lease transactions completed during the quarter.
- Total Square Footage: Approximately 29.2M SF leased across Southern California.
Regional Distribution
- Inland Empire: 13.5M SF
- Los Angeles County: 12.9M SF
- Orange County: 2.5M SF
- Ventura County: 290K SF
Trend
Direct lease transaction activity strengthened again in Q2, with transaction count rising from 416 to 444 and square footage increasing from 27.1M to 29.2M SF. Both measures reached new highs in the current data set. Year over year, transaction count increased approximately 14% and leased square footage increased approximately 35%.
The Inland Empire represented more than 46% of total leased square footage, with most of its activity concentrated in buildings over 100,000 SF. Los Angeles County was nearly equal in total volume but showed a broader distribution across building sizes. Average time on market rose to 9.3 months, reinforcing that stronger transaction volume does not necessarily mean faster lease-up.
Owner Takeaway
Well-located, functional buildings with strong logistics attributes remain competitive, but owners should be prepared for longer decision timelines and more detailed tenant comparisons.
SUBLEASE MARKET
- Availability: 334 sublease listings totaling approximately 25.1M SF.
- New Additions: 91 new sublease listings totaling approximately 4.4M SF.
- Rates: Average sublease asking rates were approximately $1.304 NNN.
- Transactions: 35 sublease transactions totaling approximately 2.4M SF during the quarter.
Trend
Sublease availability continued to decline in Q2. Listings were down approximately 22% year over year, while available square footage fell approximately 30%. Newly added sublease supply also declined, extending the pullback from the 2024 peak.
Sublease transaction count decreased from the first quarter while square footage remained essentially flat. The Inland Empire accounted for approximately 1.4M SF, or roughly 61% of regional sublease volume. Average time on market increased to 8.9 months, nearly triple the level recorded in late 2022.
Owner Takeaway
Sublease competition is easing but remains significant. Owners should differentiate direct space through condition, operating efficiency, certainty of term, and a clear value proposition rather than competing on asking rate alone.
Sales Market
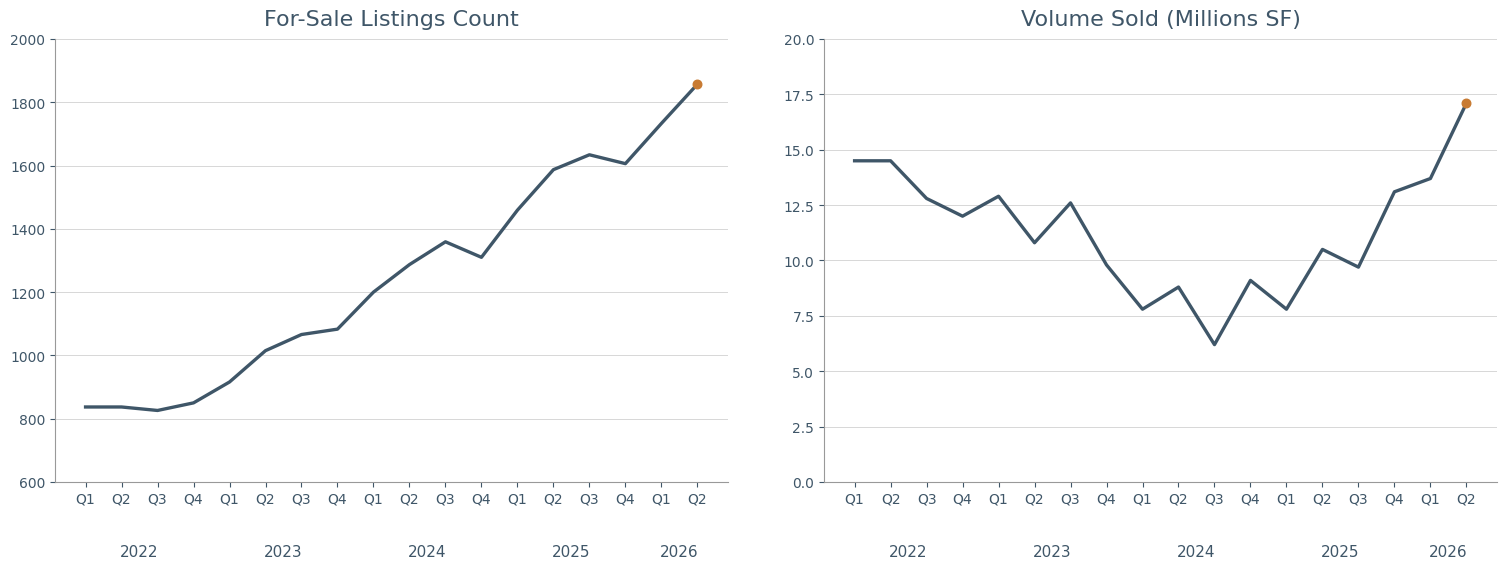
- For Sale Supply: 1,857 listings totaling approximately 80.6M SF.
- Sales Activity: 380 transactions completed during the quarter.
- Volume Sold: Approximately 17.1M SF of industrial property sold.
- Average Pricing: Approximately $311 per square foot.
Regional Leaders
- Inland Empire: 8.3M SF sold
- Los Angeles County: 5.3M SF sold
- Orange County: 3.3M SF sold
- Ventura County: 284K SF sold
Trend
For-sale inventory increased materially in Q2, with listing count up approximately 7% and available square footage up approximately 20% from Q1. Year over year, sale listings increased approximately 17% and available square footage rose approximately 34%.
Sales transaction count remained roughly steady, while square footage sold reached 17.1M SF—the highest level in the data set. A portfolio sale of 19 Link Logistics properties totaling approximately 3.1M SF contributed meaningfully to that result. Average sold pricing increased to approximately $311 per square foot, the first quarterly increase following several periods of decline, but remained about 6% below the prior year.
Owner Takeaway
Industrial assets continue to attract buyer interest, but pricing expectations should reflect current capital market conditions, higher available inventory, and more selective underwriting. Buyer activity is present, particularly for larger assets and portfolios, but the growing supply of properties for sale increases competition. Owners considering a disposition should use current underwriting assumptions and distinguish recurring market demand from volume generated by exceptional portfolio transactions.
SOUTHERN CALIFORNIA INDUSTRIAL SALES: LISTINGS VS. VOLUME SOLD
CONSTRUCTION PIPELINE
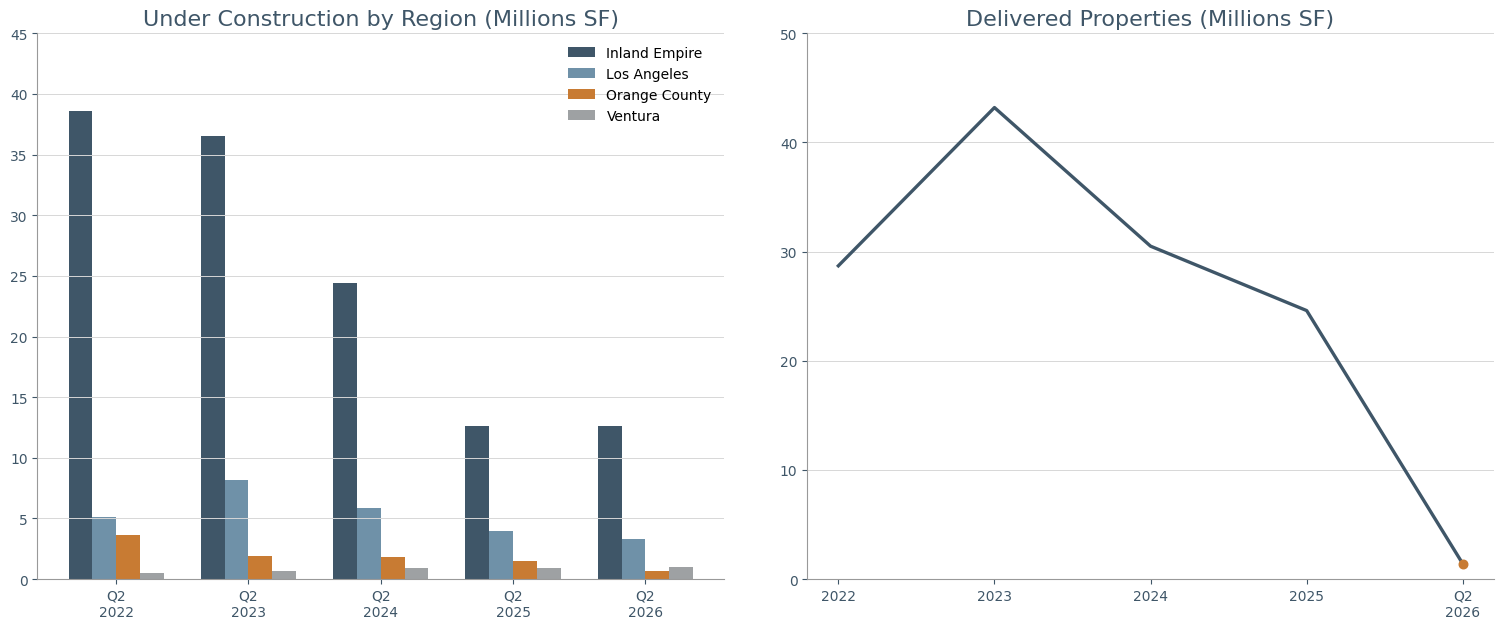
- Under Construction: Approximately 17.6M SF currently under construction across Southern California.
Regional Distribution
- Inland Empire: 12.6M SF
- Los Angeles County: 3.3M SF
- Orange County: 671K SF
- Ventura County: 991K SF
- Deliveries: Approximately 1.4M SF completed during Q2 2026, with approximately 6.5M SF projected for Q3 2026.
Trend
The active construction pipeline declined approximately 8% year over year and remains far below the levels recorded in 2022 and 2023. The Inland Empire accounts for approximately 72% of current construction. Los Angeles County and Orange County both posted substantial year over year declines, while Ventura County recorded a modest increase from a much smaller base.
Only approximately 1.4M SF delivered during Q2. Certificate-of-occupancy delays held back several properties expected to transition from under construction to completed status, contributing to the low quarterly delivery total. Proposed listings, however, reached new highs, meaning future development potential remains substantial even as the active pipeline contracts.
Owner Takeaway
The reduced active pipeline is constructive for long-term supply balance, but owners should not assume immediate relief. Existing availability, delayed deliveries, and a growing proposed pipeline will continue to influence competitive conditions.
SOUTHERN CALIFORNIA INDUSTRIAL CONSTRUCTION
STRATEGIC RECOMMENDATIONS FOR OWNERS
- Distinguish Market Activity from Market Absorption: Record leasing volume is encouraging, but direct lease availability also reached a new high. Owners should not assume that stronger transaction activity means competition has eased; property-specific positioning remains critical.
- Build Longer Decision Cycles into Leasing Strategy: With direct and sublease transactions taking considerably longer to complete, owners should begin renewals and marketing earlier, maintain realistic carrying-cost assumptions, and avoid waiting until vacancy is imminent to adjust strategy.
- Use the Decline in Sublease Supply to Reassess Positioning: Sublease availability is moving lower, which may gradually reduce discounted competition. Owners should monitor whether this improves leverage within their specific submarket before changing concessions or rate expectations.
- Evaluate Sale Opportunities Against a More Crowded Market: For-sale inventory rose substantially in Q2, even as total square footage sold increased. Owners considering a disposition should distinguish broad sales volume from demand for their particular asset size, quality, location, and income profile.
- Plan for a Two-Speed Supply Environment: The near-term construction pipeline is shrinking, which may support longer-term stabilization, but proposed development continues to build, particularly in the Inland Empire. Owners should evaluate both immediate competitive supply and future projects that could affect leasing or valuation.
Connect with GM Properties
Market data is most useful when it is translated into a property-specific strategy. GM Properties helps commercial real estate owners evaluate leasing conditions, strengthen asset performance, and make informed decisions through property management, asset management, and brokerage services across Southern California.
Contact GM Properties to discuss how the Q2 trends may affect your property, portfolio, or upcoming real estate decisions.